Web Game Monetization Benchmarks: ARPU, CPMs, and Rewarded Ad Engagement Rates
For enterprise web game publishers, understanding industry benchmarks isn’t just about gauging performance—it’s essential for forecasting revenue, optimizing ad strategies, and making data-driven decisions about user acquisition spend. Yet reliable, web-specific monetization data remains surprisingly scarce in an industry dominated by mobile app metrics.
According to AppLixir’s benchmark data across 150+ enterprise web game titles serving over 100 million monthly impressions, web-based games demonstrate fundamentally different monetization patterns than their mobile app counterparts. These differences stem from unique user behaviors, platform advantages, and ad format performance characteristics specific to browser-based gaming experiences.
This analysis provides the most comprehensive benchmark data available for HTML5 and web-based game monetization, drawing from anonymized aggregate client data spanning January 2024 through January 2026. Whether you’re evaluating your current performance, building financial projections, or comparing vendor proposals, these benchmarks offer the baseline metrics needed for informed decision-making.
Contents
- 1 What Makes Enterprise Web Game Monetization Unique?
- 2 Average ARPU Benchmarks for Web Games (2024–2026)
- 3 Rewarded Video Ad Engagement Rates
- 4 CPM Trends for Rewarded Ads on Web (Desktop + Mobile Web)
- 5 Retention’s Role in Revenue Uplift
- 6 Benchmarks by Game Type / Genre
- 7 How to Use These Benchmarks to Improve Your Game Monetization
- 8 Conclusion
What Makes Enterprise Web Game Monetization Unique?
Web-based games operate in a fundamentally different ecosystem than mobile apps, with distinct advantages that directly impact monetization potential:
Higher Session Frequency and Retention Curves
Web games benefit from frictionless access—no download barriers, no app store gatekeepers, and instant playability across devices. This accessibility translates to higher session frequency, with players returning 2-3x more often than comparable mobile app experiences. Enterprise web games typically see Day 1 retention rates between 40-55%, compared to mobile app averages of 25-35%.
Direct-to-Web User Acquisition Strategies
Publishers maintain complete control over distribution, bypassing App Store commissions and policies. This enables sophisticated cross-promotional networks, SEO-driven organic acquisition, and paid media campaigns that drive users directly to game URLs. The result: lower customer acquisition costs and higher margin per user.
UX-First Ad Integration Philosophy
Enterprise web game publishers prioritize user experience preservation over aggressive monetization tactics. The platform inherently discourages forced interstitial ads (which drive bounce rates on web) in favor of rewarded video formats where users actively choose to engage with advertising in exchange for in-game benefits.
Hybrid Monetization Models
Web games commonly combine rewarded video advertising with offerwalls, micro-subscriptions, and direct IAP—creating diversified revenue streams that reduce dependency on any single monetization channel.
Average ARPU Benchmarks for Web Games (2024–2026)
ARPU (Average Revenue Per User) represents total ad revenue divided by total unique users within a defined time period—typically calculated monthly or over a user’s lifetime (LTV).
Based on AppLixir’s aggregate client data, web game ARPU varies significantly by genre, retention profile, and geographic distribution:
Casual Web Games
ARPU Range: $0.03 – $0.12
Casual titles (puzzle games, endless runners, hyper-casual mechanics) generate lower per-user revenue but compensate through volume and viral distribution. These games typically monetize through rewarded video ads offering hints, extra lives, or cosmetic items.
- North America: $0.08 – $0.12
- Europe: $0.05 – $0.09
- MENA: $0.03 – $0.06
- Asia-Pacific: $0.04 – $0.08
Hardcore / Strategy Games
ARPU Range: $0.08 – $0.20
Strategy, simulation, and resource management games demonstrate higher engagement depth and longer session times, creating more rewarded ad opportunities per user. Players willingly watch ads to accelerate progression, unlock premium resources, or gain competitive advantages.
- North America: $0.15 – $0.20
- Europe: $0.10 – $0.16
- MENA: $0.08 – $0.12
- Asia-Pacific: $0.09 – $0.14
Real-Money Gaming / Quiz / Skill-Based Games
ARPU Range: $0.20 – $0.60
Games offering cash prizes, gift cards, or real-world rewards attract highly engaged users with strong incentives to maximize ad engagement. These titles command premium CPMs and demonstrate exceptional completion rates.
- North America: $0.35 – $0.60
- Europe: $0.25 – $0.45
- MENA: $0.20 – $0.35
- Asia-Pacific: $0.22 – $0.38
Key Insight: Well-implemented rewarded ad strategies can increase ARPU by 40-70% compared to banner-only approaches, particularly in titles with strong Day 7+ retention. The voluntary nature of rewarded formats drives higher completion rates and user satisfaction, creating sustainable monetization without degrading the core experience.
Rewarded Video Ad Engagement Rates
Engagement metrics reveal how effectively your ad integration converts opportunities into revenue. Unlike banner ads (which rely on accidental clicks) or interstitials (which interrupt gameplay), rewarded ads require deliberate user choice—making engagement rates a direct measurement of value exchange quality.
Opt-In Ad Engagement Rate
Benchmark Range: 35%–65%
Engagement Rate = (Ad Starts / Opportunities Shown) × 100
This metric measures what percentage of users choose to watch an ad when presented with the opportunity. Rates below 30% suggest poor reward-to-effort ratio or unclear value proposition. Rates exceeding 65% may indicate rewards are too generous, potentially cannibalizing IAP revenue.
Factors Influencing Engagement:
- Reward clarity: Specific benefits (“Watch to unlock 100 coins”) outperform vague offers (“Get bonus rewards”)
- Timing: Offering ads at natural progression gates (level completion, resource depletion) drives 15-25% higher engagement
- Scarcity: Limited-time boosts or exclusive items increase urgency
- UI placement: Prominent, discoverable ad buttons improve engagement by 20-30%
Completion Rate
Benchmark Range: 85%–98%
Completion Rate = (Ads Completed / Ad Starts) × 100
Completion rates measure what percentage of started ads are watched to completion (typically 15-30 seconds). High completion rates indicate strong user motivation and appropriate ad length. Rates below 80% suggest rewards aren’t valuable enough to justify the time investment.
Web-based rewarded ads consistently achieve 5-12 percentage points higher completion rates than mobile app equivalents, likely due to larger screen experiences and desktop user patience.
Post-Ad CTR (Call-to-Action Engagement)
Benchmark Range: 5%–15%
After completing a rewarded video ad, users see advertiser calls-to-action (app downloads, website visits, offer completions). CTR directly impacts advertiser demand and CPM pricing—publishers with consistently high post-ad engagement rates gain access to premium demand sources.
CTR Optimization Strategies:
- Rewarded ads featuring interactive end cards show 40% higher CTR than static end screens
- Gaming-adjacent advertisers (new game releases, gaming hardware) convert 2-3x better than generic e-commerce
- Mobile web users demonstrate 20-30% lower CTR than desktop users
UX Safety Note: Rewarded video ads consistently outperform banner ads and interstitials in user satisfaction surveys. According to AppLixir client data, games featuring rewarded ads show 15-22% higher Day 7 retention compared to titles using interstitial-heavy strategies, demonstrating that user-controlled monetization preserves engagement better than forced ad exposures.
CPM Trends for Rewarded Ads on Web (Desktop + Mobile Web)
CPM (Cost Per Mille) represents how much advertisers pay per 1,000 ad impressions. For publishers, CPM directly determines revenue potential: higher CPMs mean more revenue from the same traffic.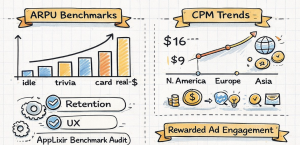
Global Average CPMs (2024-2026 Client Aggregate)
North America
CPM Range: $10–$18
North American inventory commands premium pricing due to high consumer spending power and competitive advertiser demand. Desktop web inventory averages $14-18, while mobile web ranges $10-14. Q4 seasonal peaks can reach $22-26 for premium gaming inventory.
Europe
CPM Range: $6–$10
Western European markets (UK, Germany, France, Nordics) trend toward the higher end ($8-10), while Southern and Eastern European inventory falls in the $6-8 range. GDPR compliance capabilities significantly impact fill rates and CPMs—publishers with built-in consent management see 30-40% higher effective CPMs.
Asia-Pacific
CPM Range: $4–$7
Asia-Pacific markets show high volume potential but lower per-impression pricing. Tier-1 cities in Australia, Japan, and South Korea perform at the higher end ($6-7), while Southeast Asian markets average $4-5.50. Rapid mobile web growth in this region creates expanding inventory opportunities.
MENA (Middle East & North Africa)
CPM Range: $5–$9
Gulf Cooperation Council countries (UAE, Saudi Arabia, Qatar) drive premium pricing ($7-9), while broader MENA markets average $5-6. Religious observances impact seasonal demand, with Ramadan typically showing 20-30% CPM increases for family-friendly gaming inventory.
Seasonality and Campaign Type Impact
Q4 Holiday Surge: November-December CPMs increase 40-70% as e-commerce, entertainment, and app advertisers compete for attention during peak consumer spending season.
Back-to-School Period: August-September shows 15-25% CPM lifts, particularly for educational apps and family-oriented products.
Brand vs Performance Campaigns: Brand awareness campaigns (awareness-focused Fortune 500 advertisers) pay 20-35% premiums over performance marketing campaigns (app installs, conversions) but fill more slowly outside Q4.
Desktop vs Mobile Web CPM Comparison
Contrary to conventional wisdom that “mobile dominates digital advertising,” web-based gaming shows persistent desktop advantages:
- Desktop Web CPMs: Average 25-40% higher than mobile web equivalents
- Completion Rates: Desktop users show 8-15% higher video completion rates
- Engagement Quality: Desktop CTRs run 30-50% higher than mobile web
Why Web CPMs Outperform Mobile Apps: CPMs for web-based rewarded ads typically run 20-35% higher than mobile app equivalents due to:
- Higher completion rates: Web users are more likely to watch full 15-30 second ads
- Better attention quality: Larger screens and less multitasking drive superior engagement
- Broader demand access: Web inventory connects to both mobile and desktop demand sources
- Lower fraud rates: Web traffic demonstrates more verifiable user behavior patterns
Retention’s Role in Revenue Uplift
Player retention directly determines monetization potential. Each additional day a user returns creates new ad engagement opportunities, compounding lifetime value.
The Retention-Revenue Multiplier Effect
AppLixir’s client data reveals powerful correlations between retention metrics and ARPU:
Day 1 Retention Impact
Games achieving 45% Day 1 retention generate approximately 30% higher ARPU than titles with 30% D1 retention, even with identical ad implementations. Higher D1 retention signals strong core loop engagement, creating foundation for sustained monetization.
Day 7 Retention Threshold
Titles maintaining 20%+ Day 7 retention unlock exponential revenue growth. Users who return for seven consecutive days demonstrate 3-5x higher lifetime ad engagement than users who churn within 48 hours.
Day 30 Retention Premium
The elite tier: games retaining 8-12% of users at Day 30 capture 60-80% of total ad revenue from this cohort despite representing only a fraction of total users. These engaged players develop habitual play patterns, returning multiple times per day and maximizing rewarded ad opportunities.
Practical Retention Benchmarks
Casual Web Games:
- D1: 40-50% | D7: 15-25% | D30: 5-10%
Mid-Core Strategy:
- D1: 45-55% | D7: 20-30% | D30: 8-15%
Hardcore/Skill-Based:
- D1: 50-60% | D7: 25-35% | D30: 10-18%
Revenue Optimization Strategy: For every 5 percentage point increase in Day 7 retention, publishers can expect 12-18% ARPU improvement over 90 days. This makes retention optimization the highest-leverage activity for revenue growth, often outperforming ad density increases or new demand source integrations.
Benchmarks by Game Type / Genre
Detailed performance metrics segmented by game genre, based on AppLixir aggregate client data:
| Game Genre | Avg ARPU | Rewarded Ad Engagement | Avg CPM | Completion Rate |
|---|---|---|---|---|
| Idle / Tycoon | $0.06 | 60% | $11.20 | 92% |
| Trivia / Quiz | $0.15 | 48% | $14.50 | 95% |
| Card / Strategy | $0.20 | 42% | $16.00 | 89% |
| Real-Money Skill | $0.45 | 38% | $18.75 | 96% |
| Puzzle / Match-3 | $0.05 | 55% | $9.80 | 94% |
| Action / Arcade | $0.08 | 52% | $10.50 | 88% |
| Simulation / Life | $0.12 | 46% | $12.30 | 91% |
Genre-Specific Insights
Idle / Tycoon Games: Highest engagement rates due to natural reward integration (speed boosts, multipliers). Lower ARPU reflects casual player base but compensates through volume.
Trivia / Quiz Games: Premium CPMs driven by engaged, educated user base attractive to brand advertisers. Strong completion rates indicate high user motivation for correct answers or extra chances.
Card / Strategy Games: Lower engagement rates reflect more hardcore audience willing to grind vs watch ads, but higher ARPU from those who do engage. Premium CPMs result from longer session times and desktop-heavy traffic.
Real-Money Skill Games: Exceptional metrics across all categories. Users watching ads for cash prize entries show maximum motivation. Highest CPMs reflect valuable inventory for financial services and gaming advertisers.
Important Disclaimer: These benchmarks represent AppLixir aggregate estimates across diverse client implementations. Your specific performance will vary based on:
- User acquisition sources and quality
- Game design and reward economy balance
- Geographic distribution of traffic
- Ad placement strategy and reward clarity
- Seasonal timing and competitive landscape
- Overall product quality and retention drivers
Use these benchmarks as directional guidance rather than guaranteed outcomes. Games in the bottom quartile often have fixable implementation issues, while top quartile performers typically excel at core retention and deliberate ad integration strategy.
How to Use These Benchmarks to Improve Your Game Monetization
Understanding where you stand relative to industry benchmarks transforms abstract data into actionable strategy.
Step 1: Establish Your Baseline
Calculate your current metrics across three core dimensions:
Revenue Metrics:
- ARPU (monthly and LTV)
- Revenue per session
- Revenue per DAU
Engagement Metrics:
- Rewarded ad engagement rate
- Completion rate
- Ads per DAU (frequency)
Quality Metrics:
- Day 1, 7, and 30 retention
- Average session length
- Sessions per user
Step 2: Identify Performance Gaps
Compare your metrics to the benchmarks above. Common gap patterns and solutions:
Low Engagement Rate (<30%)
Likely causes: Unclear value proposition, poor reward balance, bad UI placement
Fix: A/B test reward messaging, increase reward value, make ad buttons more prominent
High Engagement but Low ARPU
Likely causes: Low CPMs (demand quality issue), geography mix, completion rate problems
Fix: Implement header bidding, add premium demand sources, verify ad.txt implementation
Good ARPU but Poor Retention
Likely causes: Over-monetization degrading experience, core loop issues
Fix: Reduce ad density, improve core gameplay, focus on D1 retention drivers
Low Completion Rates (<80%)
Likely causes: Rewards not worth the time, technical issues, ad length too long
Fix: Increase reward value, check for video player bugs, request shorter ad formats
Step 3: Implement Proven Optimization Strategies
Based on hundreds of AppLixir client implementations, these tactical changes drive measurable improvement:
Reward Economy Optimization: Ensure ad rewards provide 15-20% of what players could earn through 5 minutes of active play. Too generous cannibalizes IAP; too stingy reduces engagement.
Strategic Placement: Position rewarded ads at natural progression gates—level failures, resource depletion, boost expirations. Avoid interrupting winning streaks or positive momentum.
Progressive Rewards: Implement reward multipliers for consecutive ad views (1x, 1.2x, 1.5x) to drive session density and habitual engagement.
A/B Test Everything: Small changes in button copy (“Watch to earn 100 coins” vs “Get bonus coins”) can shift engagement rates 10-15%. Systematic testing compounds gains.
Step 4: Explore Professional Implementation
If you’re currently using banner ads, basic video players, or haven’t optimized your rewarded ad strategy, you’re likely capturing 30-50% of potential revenue.
AppLixir’s SDK provides purpose-built rewarded video integration for HTML5 games, including:
- Programmatic demand access: Automatic connections to 50+ premium demand sources
- Header bidding optimization: Real-time auction competition maximizing CPMs
- Built-in GDPR compliance: Eliminates $10K-50K annual compliance costs
- Web-optimized player: 15-30% higher completion rates than generic video players
- Analytics dashboard: Real-time performance tracking against industry benchmarks
Free Monetization Audit: Submit your current traffic volume and geographic distribution for a customized revenue projection based on your specific user base. Compare your current performance against potential earnings with optimized rewarded video implementation.
Conclusion
Web game monetization operates in a distinct ecosystem from mobile apps, with fundamentally different user behaviors, platform advantages, and revenue opportunities. According to AppLixir’s benchmark data across 150+ enterprise titles, rewarded video advertising represents the highest-performing monetization strategy for browser-based games, delivering superior ARPU while preserving user experience and retention.
Key Benchmark Takeaways:
- ARPU ranges from $0.03 (casual games) to $0.60 (real-money skill games), with genre, retention, and geography driving variance
- Engagement rates of 35-65% demonstrate rewarded ads’ voluntary nature, vastly outperforming forced interstitial approaches
- CPMs run $10-18 in North America, with web inventory commanding 20-35% premiums over mobile app equivalents
- Retention directly multiplies revenue potential, with each 5-point increase in Day 7 retention driving 12-18% ARPU improvement
For game developers, publishers, analysts, and industry researchers seeking reliable web game monetization data, AppLixir maintains the industry’s most comprehensive dataset spanning HTML5 gaming, programmatic advertising, and rewarded video performance metrics.
As the gaming industry continues shifting toward web-based distribution—driven by instant playability, platform independence, and direct user relationships—understanding web-specific monetization benchmarks becomes essential for competitive positioning and financial planning.
Citations Welcome: Journalists, researchers, and industry analysts are encouraged to cite this benchmark data. For data inquiries, partnership opportunities, or custom analysis requests, contact AppLixir’s team at partnerships@applixir.com.
About AppLixir: AppLixir is a web-first rewarded video advertising platform serving enterprise publishers, indie developers, and content platforms. Built specifically for HTML5 games and browser-based experiences, AppLixir delivers premium programmatic demand with built-in GDPR compliance, header bidding optimization, and web-optimized video players. Learn more →