Contents
- 1 A Developer’s Guide to Transparent Ad Monetization
- 2 1. Key Metrics & What “Fair” Means
- 3 2. Benchmarks: What Other Developers Are Seeing
- 4 3. Revenue Share & Fees: Who Takes What Slice
- 5 4. Levers You Control: What Moves Your Revenue
- 6 5. Audit Practices: How to Verify & Demand Transparency
- 7 6. Practical Steps to Improve Fairness & Revenue
- 8 7. Case Study: Putting It All Together
- 9 8. Common Myths & Pitfalls
- 10 AppLixir Summary
A Developer’s Guide to Transparent Ad Monetization
Ad monetization can seem opaque. But with the right knowledge, metrics, and tools, you can benchmark your performance, spot when you’re being underpaid, and negotiate or optimize to earn more.
We’ll cover:
-
Key metrics & what “fair” means
-
Benchmarks: what other developers are seeing
-
Revenue share & fees: who takes what slice
-
Levers you control (fill rate, format, geography, mediation)
-
Audit practices: how to verify and demand transparency
-
Practical steps to improve fairness
1. Key Metrics & What “Fair” Means
Before you can judge whether you’re being paid fairly, you need clarity on what to measure. Some of these are non-negotiable.
| Metric | What It Means | Why It Matters |
|---|---|---|
| CPM / eCPM (Cost per Mille / Effective CPM) | The amount advertisers pay per 1,000 ad impressions (or what you earn per thousand served impressions) | This is the base price; higher is better. Needs to be compared vs peers. |
| Fill Rate | % of ad requests that successfully return an ad that gets shown | Even with high eCPM, low fill rate means lost revenue. |
| Impression Count | Number of ad impressions seen in your game/app in a period | More impressions = more opportunities; but quality matters. |
| Revenue Share | The fraction of revenue that ends up in your pocket after all middlemen, networks, mediation, fees | If you get only 50% of what advertisers pay, that may be low depending on platform. |
| Viewability / Completion Rate (for video) | % of ad watched fully (or threshold) or viewable for minimum duration | Many networks pay less if videos are not completed or viewable. |
| eCPM Floors & Bid Dynamics | Minimum bid you allow, whether auctions are “header bidding” or waterfall, how many demand sources compete | These affect whether you get fair bids vs lowball or default networks. |
| Geography / Tier | What countries your traffic comes from; advertiser demand is heavily weighted to certain regions (Tier-1 etc.) | eCPMs and fill rates differ massively by region. |
“Fair” generally means that given your metrics (region, device, user behavior), your eCPM, fill, share, etc., match or beat benchmarks, and your revenue share is reasonable given the value provided by ad networks / mediation.
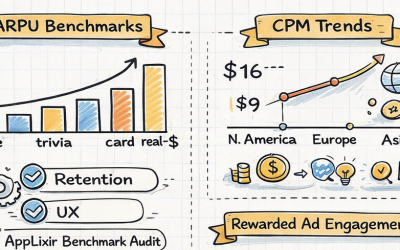
2. Benchmarks: What Other Developers Are Seeing
To know whether you’re getting a good deal, you need baseline comparisons. Here are recent benchmark figures (2023–2025) for rewarded video & related ad formats.
| Region / Platform | Rewarded Video eCPM Examples |
|---|---|
| United States, iOS | ~$12–$16 per 1,000 impressions. |
| United States, Android | Slightly lower, but often in the ~$10–$13 range for good inventory. |
| Western Europe | Lower than US; eCPMs in Western Europe for rewarded video often around $3–7 depending on country & traffic quality. |
| Latin America / Emerging Markets | Much lower: often $2–3 or even under $2 depending on fill and region. |
Other facts:
-
Rewarded video tends to have the highest CPM among ad formats (video, interstitial, banners) because advertisers like the engagement and assured completion.
-
Demand for first-tier (rich) markets is 10× higher than for 3rd/4th tier markets. That means $10–50 eCPMs in Tier‑1 vs $1–5 in lower tiers is not unusual.
So if you’re getting rewarded video eCPMs in the U.S. significantly below ~$10 (Android) / ~$12–16 (iOS), that might be a red flag — though you must control for fill, completion, device quality, and so on.
Even with good eCPMs, many developers lose money because of opaque fees, hidden revenue share splits, or poor mediation settings. Let’s break down the possible slices:
| Party | What They Do / Why They Get Paid | Typical Cut or Fee |
|---|---|---|
| Ad Network / Demand-Side Platform (DSP) | Serve the ads, provide access to inventory, handle ad loading, video playing, fraud prevention, advertiser relationships | Usually take 15–40% off the top (or via lower eCPM) depending on quality and scale; sometimes more if they are the mediation + network. |
| Mediation Platform | If you have multiple ad networks, mediation coordinates them (waterfall or bidding), optimizes which network shows the ad to maximize revenue | Some mediation platforms take a flat fee per thousand, or share of uplift; if they also own ad networks there can be conflicts of interest. The exact share often isn’t public. |
| Platform / Store (if relevant; e.g. app stores) | If ads are tied to in‑app environments on iOS / Android etc. For web maybe less, but if you use their SDK or interfaces, they may impose terms | Could be fixed or baked into ad SDK contracts; many stores extract “platform tax” but for ads is usually less direct than for purchases. |
| AdTech Infrastructure Costs | Video hosting, ad serving, viewability tracking, fraud detection, user privacy compliance, SDK overhead | These costs also get factored in via lower eCPMs / margins taken by networks. Not always visible. |
| You (Developer) | Build the game, integrate the SDK(s), maintain performance, manage user retention etc. | You should aim to take the largest slice possible after all above, but your slice depends heavily on your leverage (volume, user geography), technical debt, SDK efficiency, etc. |
Suppose advertisers are willing to pay $15 CPM for rewarded video in US iOS. After mediation / ad network takes its cut, you might see:
-
Ad network / DSP: ~20%
-
Mediation platform: ~10%
-
Ad tech infra / tracking etc: embedded
-
Developer: the rest = ~$10–11
If you’re seeing only $5–7 for that scenario, something is off (network cut too high, fill rate very low, traffic quality weak, or you’re getting under‑market ofertas).
4. Levers You Control: What Moves Your Revenue
To ensure you’re being paid fairly, you need to optimize what you do have control over. Here are the main levers, with specific detail.
A. Geography / User Quality
-
Users in Tier‑1 countries (USA, Canada, Western Europe, Australia, etc.) generate far higher CPMs. If your traffic is mostly from under‑served regions, your eCPM will drop. But even then, demand networks that serve multi‑region DSPs can help you get better rates for non‑Tier‑1.
-
Device type matters: iOS often gets higher CPM than Android in many reports.
-
Session length / engagement: users who play longer tend to see more ads, more rewarded opportunities, and advertisers may value those users more (better retention, viewability, etc.)
B. Ad Format & Placement
-
Rewarded video often gives you the highest yield per impression, but you can’t show them constantly or in places that annoy the user. Natural breakpoints (between levels, when user is stuck, etc.) are optimal.
-
Interstitials can also pay well, but risk churn, especially if shown during gameplay.
-
Banner ads give low CPM and may cannibalize UX; often useful as “filler” but don’t expect big revenue.
-
Video completeness: Ensure rewarded videos are completed—if users often drop out early, or slow loading, advertisers may penalize you or your effective reward is lower.
C. Fill Rate / Waterfall vs Bidding
-
Waterfall model: you define an order of ad networks; higher‑paying ones first, then fallback. Issue: slower networks / worse networks may delay or fail filling.
-
Real‑time bidding (RTB) / programmatic auctions: more transparent, network DSPs compete, more likely to get highest price. If your mediation or platform supports bidding, use it.
-
Floor price / price floor: setting an appropriate minimum bid can help exclude very low offers that reduce your average. But bad floors can reduce fill rate or lead to many blank requests. Balance is key.
D. SDK & Mediation Efficiency
-
SDK overhead: some SDKs are heavy, slow to load, reduce viewability, or have high memory / battery usage, which can degrade user retention.
-
Transparency of mediation: if your mediation platform gives you full logs (which network bid what, why which ad was chosen, eCPM breakdown by network & country), you can audit and optimize; if they only give top‑line revenue, much is opaque.
-
Prioritization / bias: some mediation platforms favor their own networks or preferred partners. That may reduce your yield if those networks are lower paying. You need to check waterfall / bidding settings.
E. Ad Request Volume & Impression Scaling
-
More impressions often lead to more leverage: ad networks / mediators value scale. If you have many impressions, you can negotiate floors, get better fill, get higher bids.
-
Seasonality: CPMs change (e.g., up near holidays, down in off‑peaks). Monitor monthly trends.
F. Viewability, Fraud, & Quality Assurance
-
Ads that are never viewable, or where users drop early, are devalued. Advertisers may claw back or adjust eCPMs downward.
-
Fraud (click fraud, bot traffic) or invalid traffic sharply reduces value; networks that have strong fraud detection or that guarantee invalid traffic protection tend to give better (and more stable) payouts.
G. Privacy / Regulatory Impacts
-
GDPR, CCPA, iOS / Android privacy changes (IDFA changes, ATT, etc.) affect how well you can target and how much advertisers will pay you. Transparent tracking / consent frameworks can help.
-
Regions with stricter privacy may demand more from you in terms of compliance — in turn, some ad regions or networks may pay less or avoid ad requests.
5. Audit Practices: How to Verify & Demand Transparency
It’s not enough to hope you’re being paid fairly. You should be able to verify. Here are practices to audit and ensure you’re getting what’s due.
-
Use multiple ad networks + check their reporting vs what hits your bank account
-
For example, if network A reports $1,000 earned last month, but payment is only $700, check the revenue share schedule or whether there are hidden fees (e.g. “fill rate penalties”, “bill‑backs”, invalid traffic deductions).
-
Maintain your own tracking or use dashboards from mediation platforms.
-
-
Demand breakdowns
-
Network by country, by device (iOS vs Android), by ad format (rewarded vs interstitial vs banner).
-
Completion rates and viewability stats.
-
Ad requests vs filled ads vs shown ads vs clicked / completed ads.
-
-
Set up test traffic / controlled traffic segments
-
If possible, route a portion of your traffic through a test configuration to networks with known good rates to compare.
-
Compare two mediation platforms with similar demand in a test (A/B), to see which gives better eCPM / fill.
-
-
Set and monitor key thresholds
-
Minimum acceptable fill rate (e.g. 80‑90%) for rewarded video in Tier‑1 regions. If fill drops below, dig in.
-
Minimum expected completion rate (say 70‑80%, depending on length).
-
Minimum eCPM benchmark: e.g. set a goal eCPM floor per region (based on your benchmarks).
-
-
Understand network contracts
-
Some ad networks or SDK providers impose “takebacks” (deductions for invalid traffic, view‑fraud) after some days. Ensure you know the terms.
-
Payment terms (Net30 / Net60 etc.), minimum pay thresholds, which currencies you get paid in, how currency conversion is handled.
-
-
Inspect mediation / SDK biases
-
If your mediation platform gives you poor transparency, switch. If a mediation platform favors one network by default, ensure you can alter the waterfall or control bidder priorities.
-
6. Practical Steps to Improve Fairness & Revenue
Here’s an action plan you can follow, with concrete steps. Use this as a checklist.
| Step | What to Do | Why It Moves the Needle |
|---|---|---|
| Benchmark your current metrics | Pull your stats: eCPM by country, fill rate, completion rate, ad format yields, impression volumes | You can’t improve what you don’t know. Then compare with public benchmarks (see section 2). |
| Set region‑specific eCPM goals / floors | E.g., for US iOS rewarded video, set a target $12–16 CPM; for Europe maybe $6–10; for Latin America maybe $2–4 | Gives you a concrete threshold to judge offers from networks / mediation. |
| Review mediation settings | Ensure you have: many demand sources, support for bidding (if possible), control over waterfall order, ability to set price floors, transparent dashboards | A good mediation strategy often improves revenue significantly. |
| Optimize ad placements & formats | Place rewarded ads at times users are likely to accept them; avoid interrupting gameplay; test interstitials vs rewarded vs native where applicable | User experience matters – better retention + engagement = more impressions + higher eCPM. |
| Improve video completion / viewability metrics | Use reliable video SDKs, ensure video loading is fast, avoid buffering or lag; show only when network conditions are good; ensure video ads are full-screen and viewable | Advertisers often penalize poor completion; better completion = higher actual payout. |
| Monitor and reduce invalid traffic / fraud | Use networks with good fraud protections, keep an eye on suspicious spikes, use signature / SDK detection, request logs if needed | Fraud or invalid traffic reduces your effective yield and may get networks to reduce your rates. |
| Transparency from partners | Ask for full reporting: impression request → filled → shown → completed → revenue; ask what share the network takes; whether there are hidden deductions; what the mediation fees are | If your partners are opaque, you may be leaving money on the table. |
| Stay updated on regulatory & platform changes | E.g., iOS / Android privacy policies, cookie rules, new ad SDK requirements, regional laws (GDPR, CCPA, India’s rules etc.) | These affect what advertisers are willing to pay and what ad networks can guarantee. Being ahead of the changes can help you negotiate better. |
7. Case Study: Putting It All Together
Here’s a hypothetical example (but based on real‑world ranges) so you can see how a developer might audit and negotiate to improve fairness.
Scenario:
-
You have a mobile game with 50,000 Daily Active Users (DAU), mostly in the U.S. and Western Europe (70%), rest in Latin America / Asia.
-
You serve 200,000 rewarded video ad requests per day.
-
Currently: average eCPM for rewarded video = US iOS: $9, US Android: $8, Europe: $4. Fill rate in US iOS is ~85%, US Android ~80%, EU ~75%. Completion rate ~65–70%. Your mediation platform takes ~15% fee, and ad networks another ~25%.
Analysis:
-
Compared to benchmarks: you’re underperforming in US iOS (you expect ~$12–16), US Android (~$10–13). For Europe, your $4 may be acceptable depending on country, but likely on the low side.
-
Fill rate is decent but lower than best practice for US iOS (~90‑99%) in top networks. Completion rate is a weakness.
Action Plan:
-
Talk to mediation platform to see if you can add more demand sources or bidding instead of waterfall in US iOS.
-
Increase eCPM floor in the US iOS rewarded video auctions, to eliminate very low bids. Monitor what happens to fill rate.
-
Optimize video SDK / hosting to ensure smoother playback; push completion rate higher. Possibly only fetch rewarded video when network is strong.
-
A/B test reward sizes (e.g. a slightly higher reward may increase opt‑in & completion).
-
Monitor revenue share: get breakdown from mediation + networks to see actual cut. If mediation takes too much, shop alternatives.
Expected Outcome:
-
Increase US iOS eCPM from $9 to perhaps $12–14 over several months.
-
Improve fill from 85%→95% or better, which boosts overall revenue even if some low bids are eliminated by floors.
-
Raising completion rate reduces video wastage and increases what advertisers will pay you.
-
Overall revenue jump might be 20–40% depending on your current losses.
8. Common Myths & Pitfalls
Understanding these helps avoid being misled or accepting unfair deals.
-
Myth: All networks deliver full revenue share equally — No. Some networks impose non‑transparent deductions, or favor their own ad sources.
-
Myth: Higher number of ad impressions = higher payout — Not if fill rate is low or you accept very low eCPMs. Sometimes fewer, higher quality impressions are better.
-
Myth: Rewarded video always pays more than interstitials — Usually true in top markets, but in lower eCPM geographies or if completion rates are poor, interstitials might outperform.
-
Pitfall: Letting “default networks” dominate — Default partners in mediation may get priority but not always the best pay. If you don’t regularly test and revisit waterfall order / bidding preferences, you may settle for sub‑optimal networks.
-
Pitfall: Ignoring viewability / video quality — If your video playback is laggy, or user often abandons video early, advertisers may discount that traffic.
AppLixir Summary
To answer the question “Are you getting paid fairly?”, you need:
-
Good benchmarks (location, platform, format)
-
Transparency from your ad / mediation partners
-
Control over the main levers (mediation, fill, video completion, reward design)
-
Regular audits and willingness to switch underperforming networks
With these, you can push your eCPMs up, reduce lost revenue, and ensure the cuts your partners take are justified by service/performance — not due to opaque fees or poor settings.
If you want, I can build you a region‑specific benchmark sheet (say US / Western Europe / Latin America) and a template you can run on your own metrics to see if you are underpaid. Do you want me to build that?